

Understand your stats to improve with every post
Lyter summarizes your LinkedIn performance and turns your data into clear recommendations: what to repeat, what to adjust, and what to test to increase reach and leads.

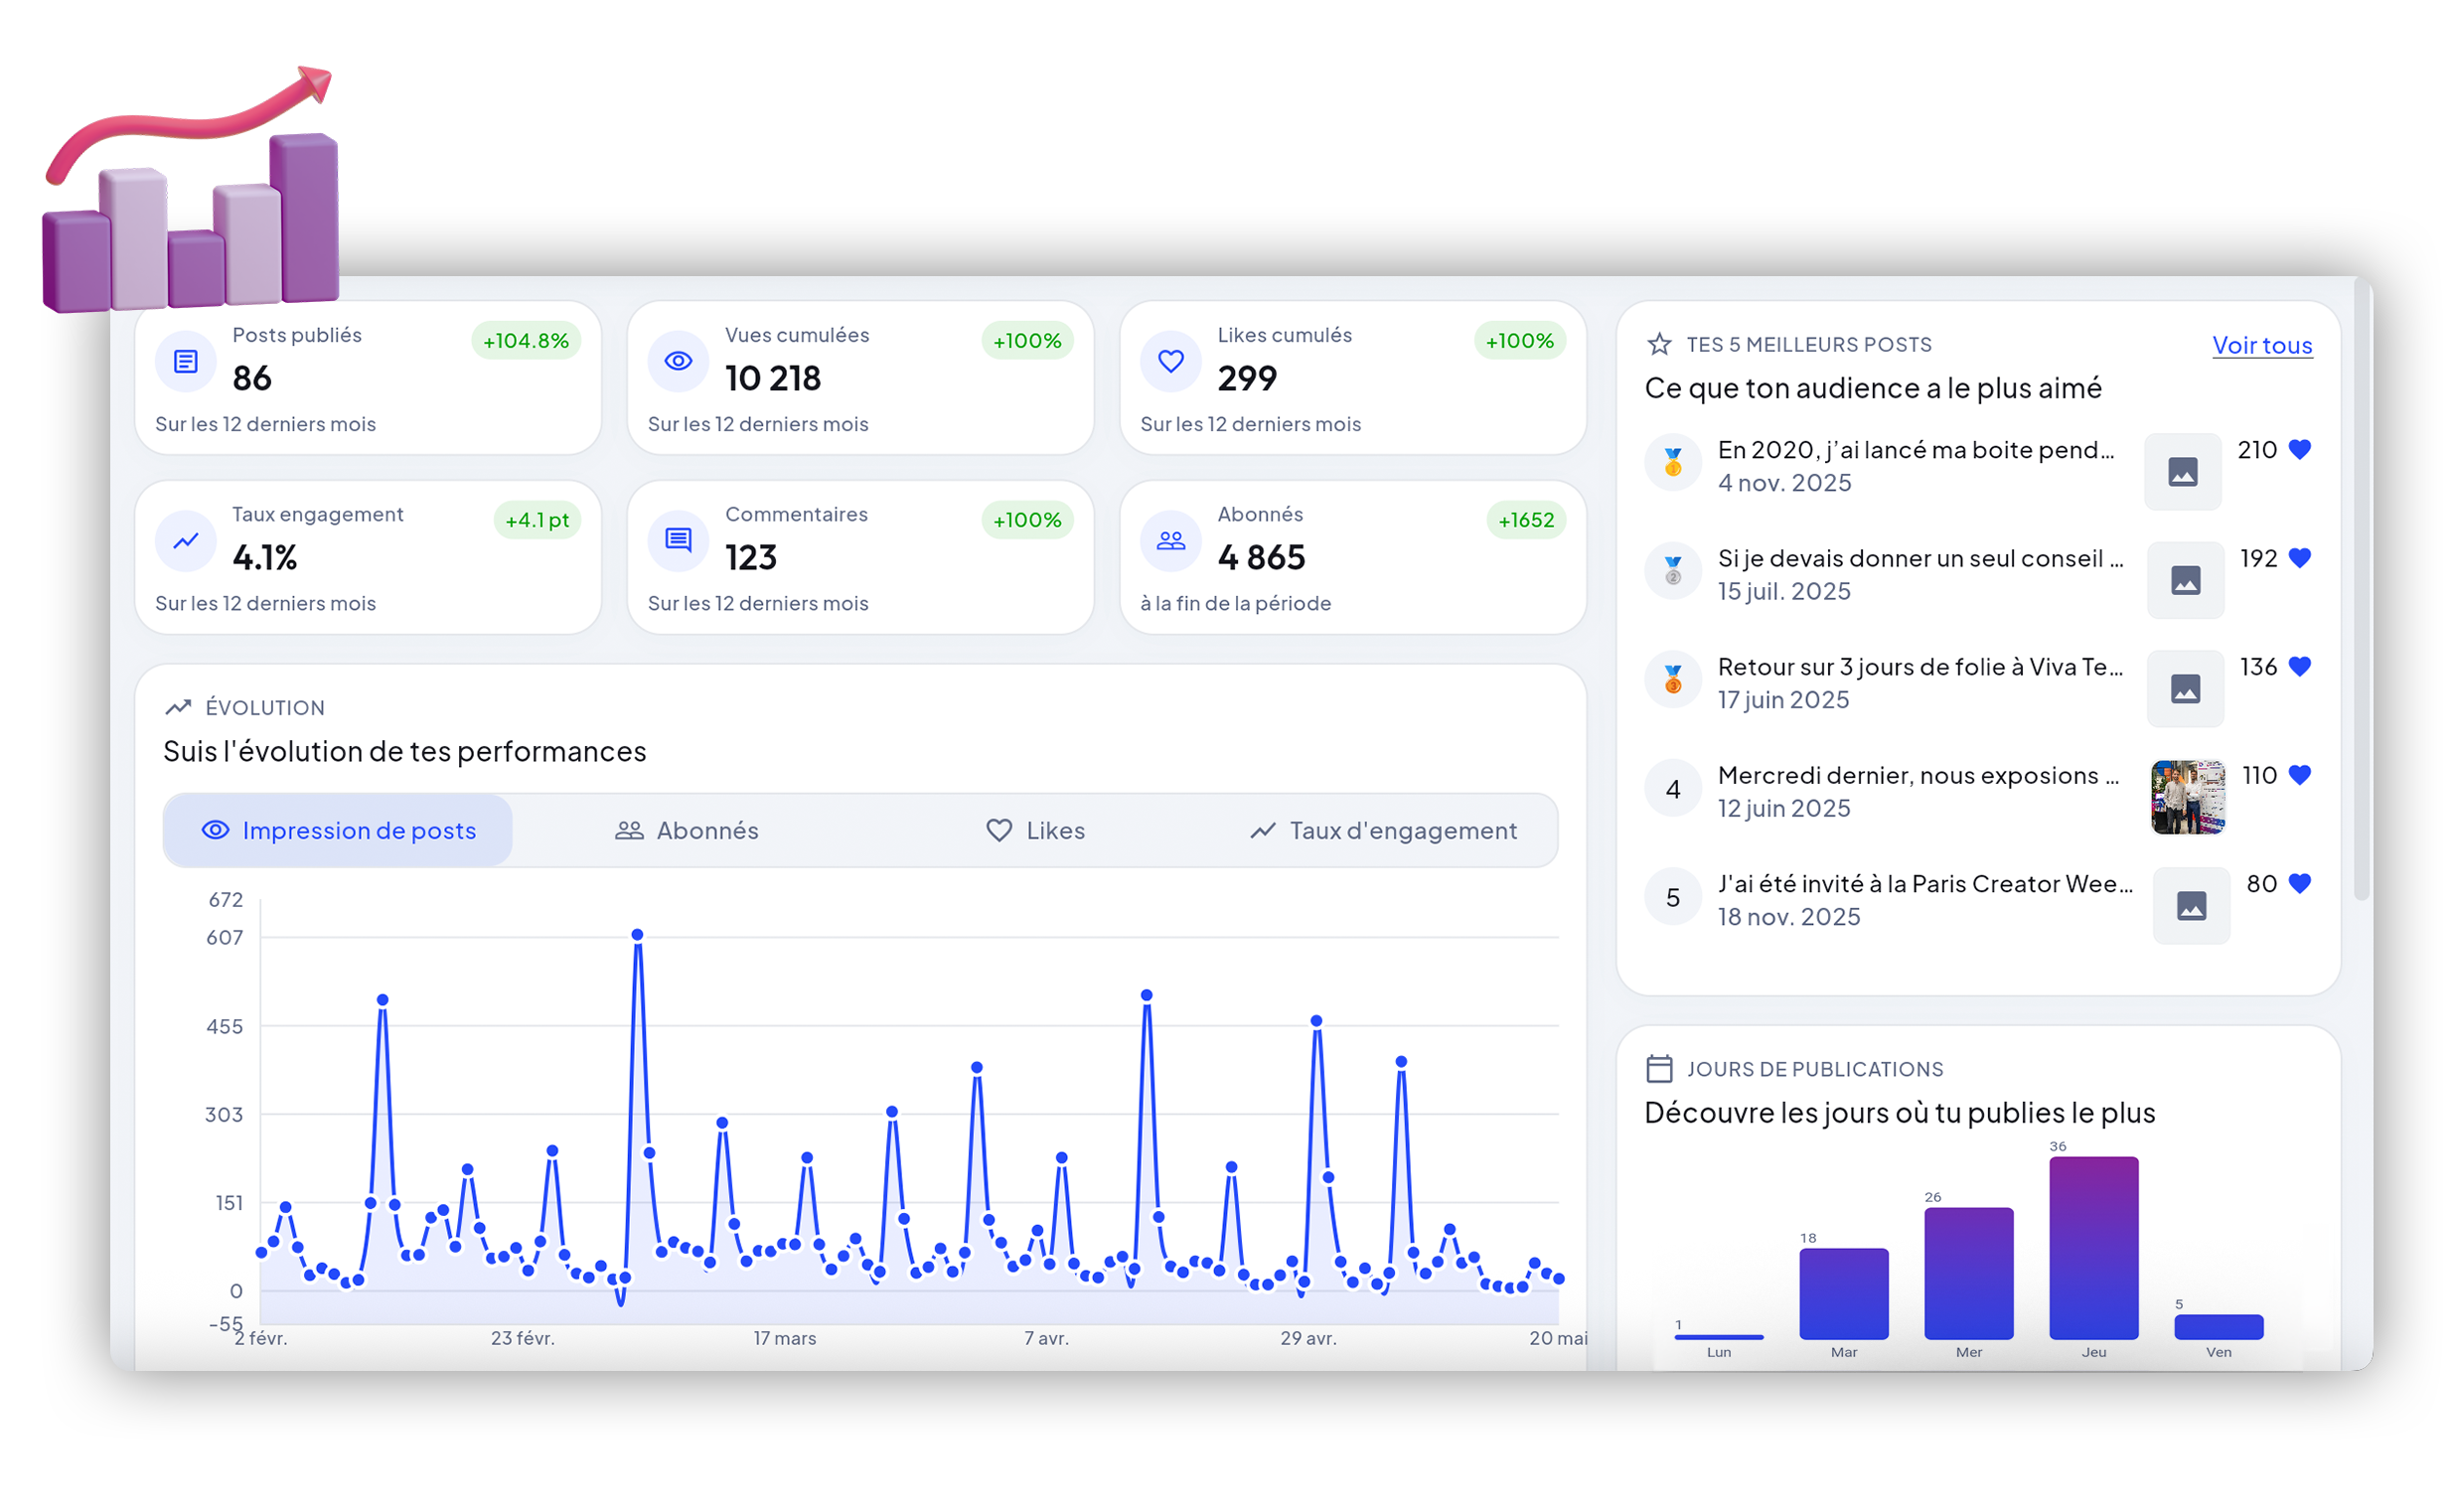
All your stats, finally easy to read
Lyter centralizes your results and shows you the essentials: reach, engagement, growth, top-performing posts, and trends over the period. You quickly know what works.

Automatic Summary
A simple dashboard, no Excel needed.

Periods & Trends
Track progress week after week.

Top Posts
Identify your top-performing posts.
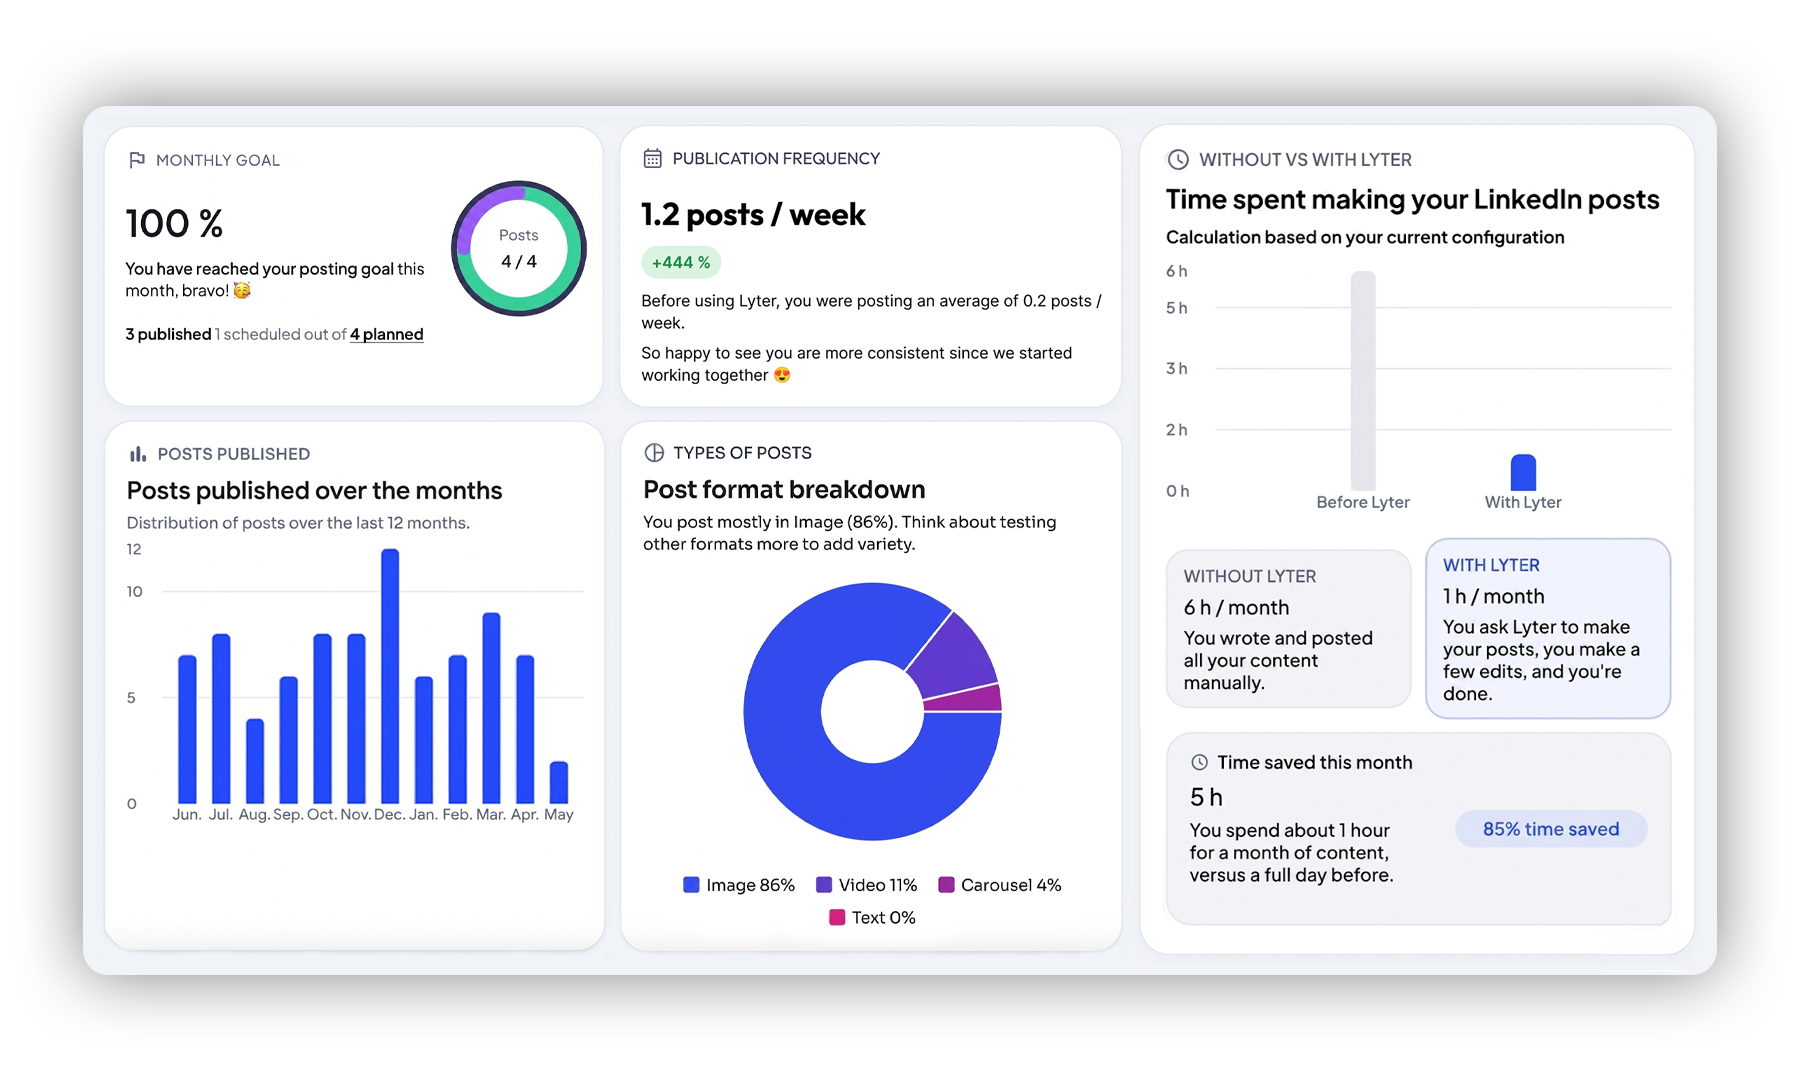
Keep an eye on your consistency and publishing habits
Lyter gives you an overview of your LinkedIn activity: monthly goals, publication frequency, format distribution, or time saved.
It's a simple way to track your consistency and identify what you can adjust to improve.
A data coach for your content
Over time, you'll better understand your audience and publish more intelligently.
Less guesswork, more learning, and better results 😌
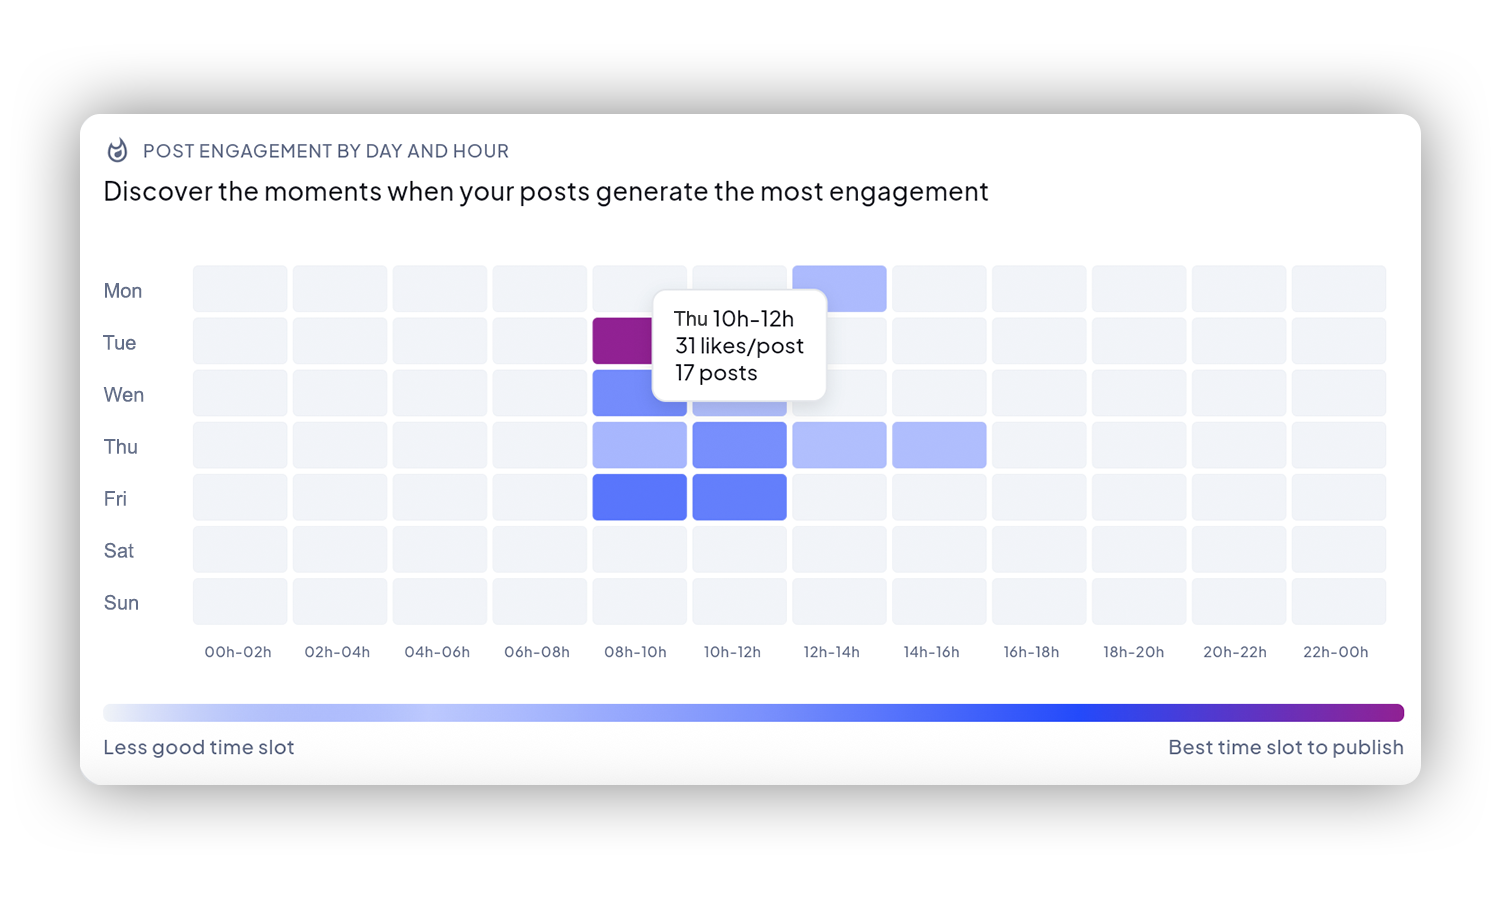
Stop just looking at the numbers: use them
Lyter compares your performance, identifies patterns, and offers concrete recommendations: formats to prioritize, topics to repurpose, angles to test, and improvements for hooks or CTAs.
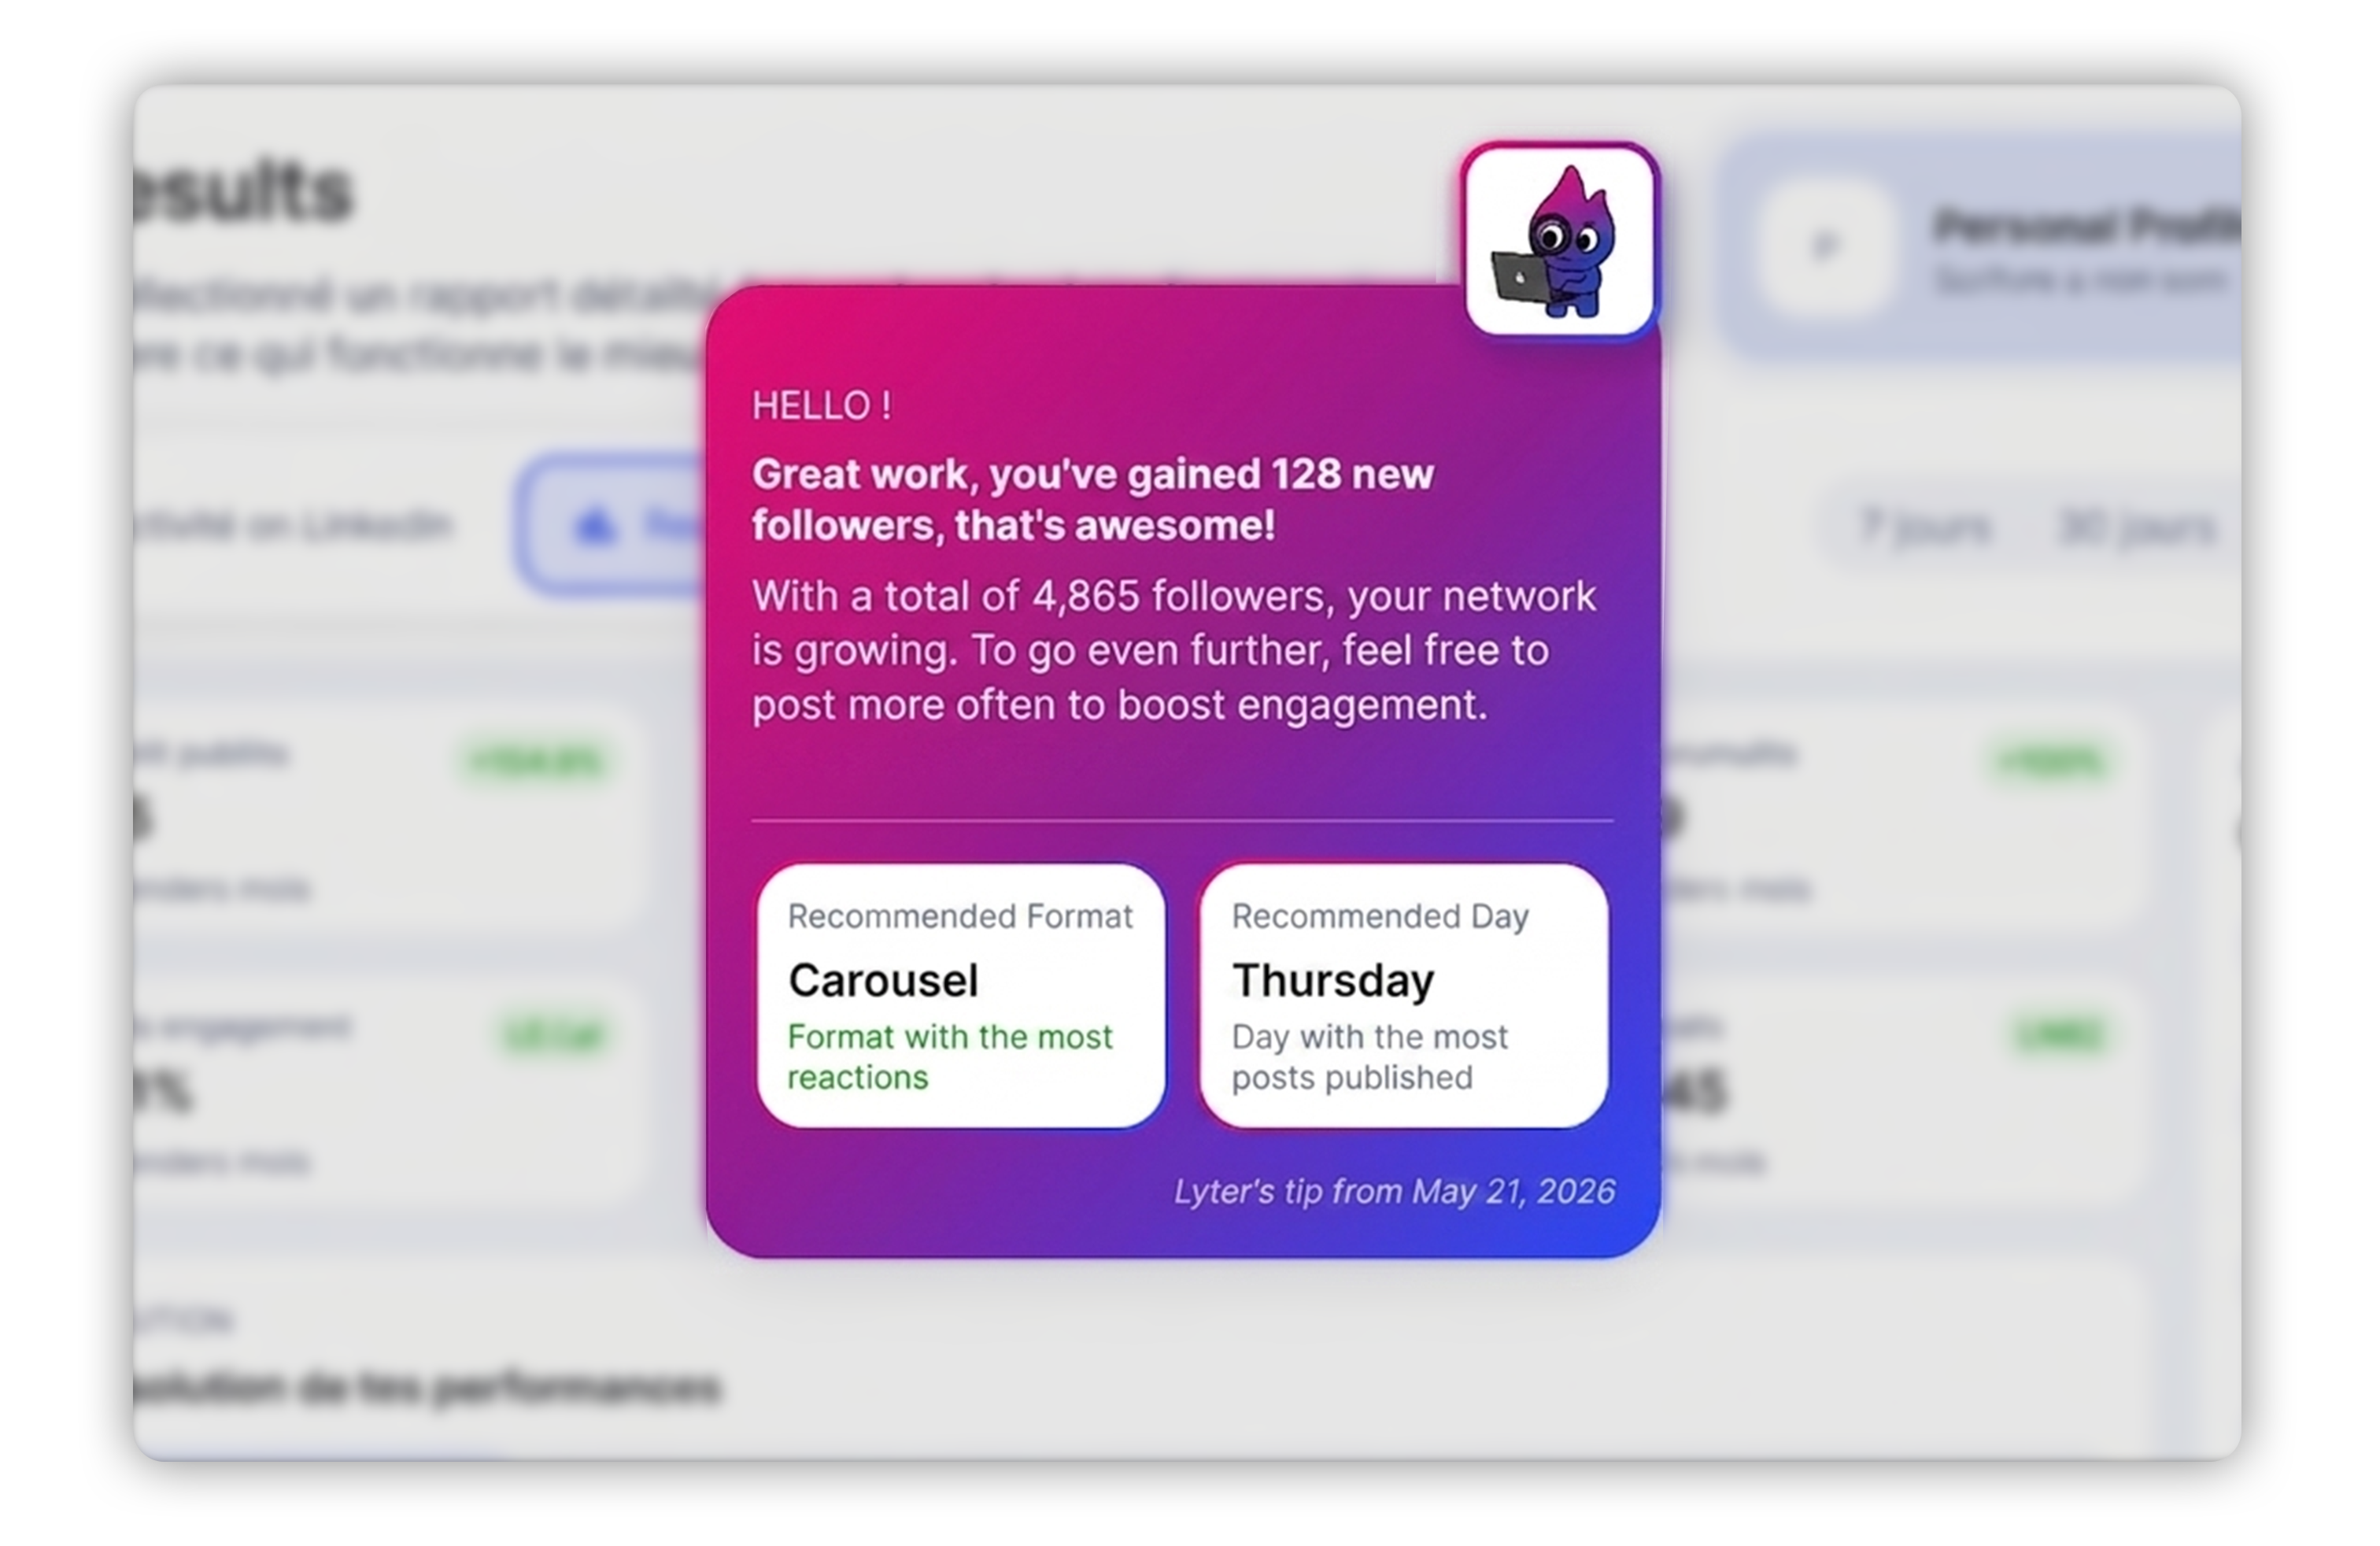

What to repeat
The formats and themes that generate the most results.

What to fix
Hooks, length, structure, CTA: specific recommendations.

What to test
Guided experiences to progress quickly.
Clear priorities
Know what to do "now" to perform faster.

Simple comparison
Spot the differences between average posts and strong posts.

Business impact
Direct your content towards more leads and conversions.
